
Blog: Mapping and distorting the Arctic
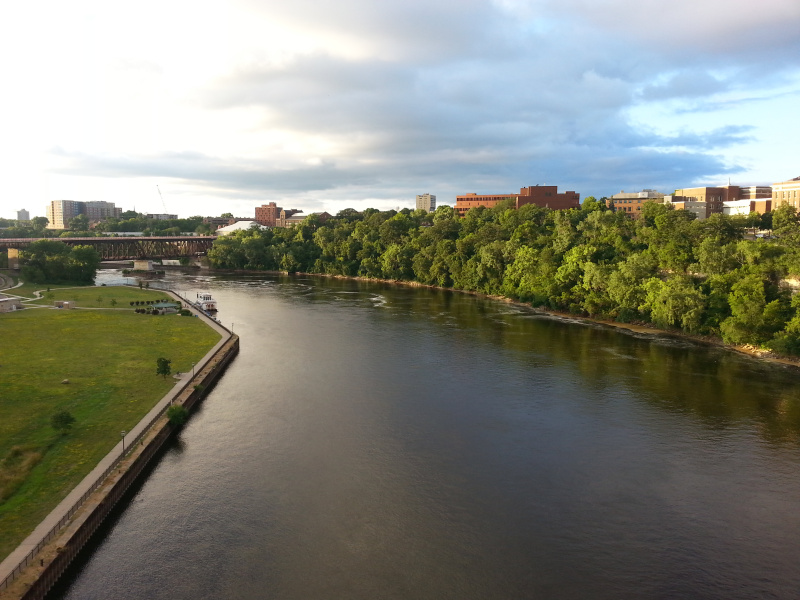
I’m here at the University of Minnesota’s Polar Boot Camp, which is run by the on-campus Polar Geospatial Center (PGC). The PGC was established in 2007 and is funded by the National Science Foundation, a United States government agency.
Though it’s only seven years old, the PGC already provides a large amount of support in the way of mapping and remote sensing services for scientific research in the Arctic and Antarctic. They’ve produced maps on everything from trails around McMurdo Station to mummified seals in the area. This is the PGC’s first-ever boot camp, and its purpose is to teach students skills in GIS, cartography, and remote sensing as they apply to the poles.
Today, Brad Herried, a cartographer and web developer at the PGC, gave a talk on polar mapping. Producing accurate maps of the poles is arguably more difficult than it is for other areas of the world such as the equator. Herried explained that this is due to four main reasons. First, all lines of longitude converge at the poles. 0 degrees west becomes the same as 180 degrees west. Two, you cross the “dreaded” 180° line in mapping. Three, north is not always north; on many polar maps with the North Pole at the center, for instance, going towards the center (as opposed to going “up”) is going north. And four, some defaults and standard projections aren’t appropriate for the poles, such as the Web Mercator projection. This projection makes Greenland appear larger than Africa even though the world’s largest island is a mere 1/14 the size of the continent, an issue which has been called “the Greenland problem.” Consequently, Web Mercator should never be used for mapping the Arctic or Antarctic, unless you really want to give some disproportionate cartographic weight to these parts of the globe.
All projections are going to require compromises. Some will preserve distance and local shapes, such as the Mercator projection, yet area will become increasingly distorted as you move towards the poles, as demonstrated with the example above.
So in the Arctic, as anywhere, some projections are better than others. For this northernmost part of the world, there are two projections that are ideal. First, there’s WGS84 NSIDC Sea Ice Polar Stereographic North. That may seem like a mouthful of acronyms, but basically, WGS84 refers to the World Geodetic System made in 1984, while NSIDC is the National Snow and Ice Data Center, based out of Boulder, Colorado. Stereographic projections are a way of projecting a sphere, like the earth, onto a flat surface, while maintaining angles. The NSIDC uses this projection to map its sea ice data products.
Second, the Alaska Albers Equal Area Conic projection is another good one to use, at least for the U.S. Arctic. As the title suggests, Albers equal area projections preserve area accurately. Since conic projections project the sphere of the earth onto a cone, they differ from stereographic ones, which fall into the category of planar projections. As mentioned above, these project the earth onto a flat (rather than conical) surface. For more on map projections and surfaces, check out Geokov.
Herried didn’t mention the Polar Azimuthal Equidistant projection, but many use it – most famously the United Nations on its flag. Azimuthal equidistant projections are able to depict the entire planet’s landmass while maintaining accurate distances and directions to all points along a straight line from the center of the map. In a polar azimuthal equidistant map, the center is either the North or South Pole. In the case of the UN flag, it’s the North Pole. It’s no surprise that the countries of the more powerful Northern Hemisphere (the Global North, anyone?) are at the center of the map.
These two above projections focus on optimally representing distance, area, and shape while avoiding distortion. There are, however, many other projections that deliberately alter one or more of these categories. Cartographic accuracy is forsaken for the visual benefit of the mapmaker. This being the Cryopolitics blog, let’s explore those alterations a bit.
Deliberate distortions of the Arctic
The media may focus on maps such as this (in)famous map produced by Durham University’s International Boundaries Research Unit on disputed and potentially disputed Arctic areas. But it can be just as interesting to look at the maps produced by various stakeholders since they subtly reveal the cartographer’s priorities in and visions of the Arctic. While no overt political conflicts are depicted in these maps, by choosing to include some things and not others, a mapmaker asserts his or her own way of viewing the world while silently contesting all others.
First, here is a map of the Soviet Arctic, dug up by one of my colleagues, year unknown. This is one of the few maps I’ve seen that puts the USSR, or Russia for that matter, “upside-down,” at least according to conventional sensibilities of which way is north. The seemingly vast Arctic Ocean stretches out below the USSR in pale blue and is devoid of pesky sea ice in this map. In addition, with the Pacific on the country’s eastern (though oddly in this map, left) coast, there no longer seems to be a problem of sea access for the USSR – at least cartographically. Furthermore, thanks to the map’s beguiling curvature, it’s the North Pole rather than Moscow that captures the viewer’s attention.
Second, it’s interesting to look at Asian-made maps of the Arctic. This map published by the Chinese Arctic and Antarctic Administration and designed by Hao Xiaoguang is instantly disorienting. It portrays China’s view of the Northern Sea Route and Northwest Passage and was widely disseminated following the release of the Stockholm International Peace Research Institute’s 2010 report by Linda Jakobson, “China Prepares for an Ice-Free Arctic.” I’m not sure what type of projection the map uses, but it manages to incorporate the Arctic, Antarctic, and China all on one page. China, in vivid fuchsia, also manages to remain sort of near the center. This is a map in which north is definitely not always north. The main ports shown are Shanghai, Rotterdam, and New York. The red and yellow labels used for these cities bear testament to the increasing presence of Chinese ships in each of these harbors – a cartographic color revolution, if you will.
A map of the Arctic made by the South Korean daily newspaper JoongAng Daily is also notable for the features it brings to the fore. Three transport routes are shown: the Northern Sea Route (NSR), the Suez Canal route, and Trans-Siberian Railway. The NSR rather than the Northwest Passage is the Arctic shipping lane of interest for South Korea. It offers a significantly shorter route compared to the Suez Canal, which is included at the bottom of this map at the expense of depicting more of the western Arctic. The only bits of that area depicted are Northern Canada and Alaska, whose hydrocarbon resources are represented by oil derricks. Korea Gas Corporation (KOGAS) has made no secret of its interest in the gas resources in the Mackenzie Valley Delta, while the country’s icebreaker, Araon, has researched methane hydrates in the area. As such, the features represented in this map come as little surprise. Finally, the fact that the Trans-Siberian Railway route is depicted sheds light on South Korea’s longstanding hope to connect to the railway to achieve overland access to markets in Russia, Central Asia, and Europe. President Park Geun-hye’s Eurasian Initiative epitomizes these grand plans, still stymied by the problem of North Korea.
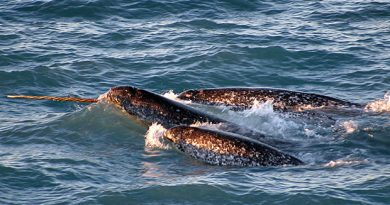
Third and last, it’s worth examining an infographic made by a non-state actor: Greenpeace, the environmental non-profit organization. In 2012, it launched its Save the Arctic campaign, for which it distributed an infographic, made by the design company Column Five. The infographic includes two maps that illustrate the journeys that year of the NGO’s ships, Esperanza and Arctic Sunrise. A simple white and teal color scheme gives the sleek graphic an icy, pure feel. Compare this to the neon party that is the Chinese map. Notice how all of the political boundaries are erased as the Arctic becomes a uniform, white landmass free of even any dots that might demarcate points of human settlement. The only living creatures in the map are cute, innocent-looking animals: narwhals, owls, whales, walruses, and foxes. The infographic is beautiful in its simplicity, but this simplicity comes at the expense of depicting the more complicated nature of life in the Arctic – life which includes four million humans.
No map is perfect, and no projection is either. Instead, all maps are quite simply ideological.
Correction: This post has been updated from an earlier version. The PGC does not have an $8 million budget.
This post first appeared on Cryopolitics, an Arctic News and Analysis blog.
