New Antarctica map may help better predict ice flow and climate impacts
A new detailed map of Antarctica is set to significantly improve predictions of how ice flows and melts in response to climate change, say the scientists behind the project.
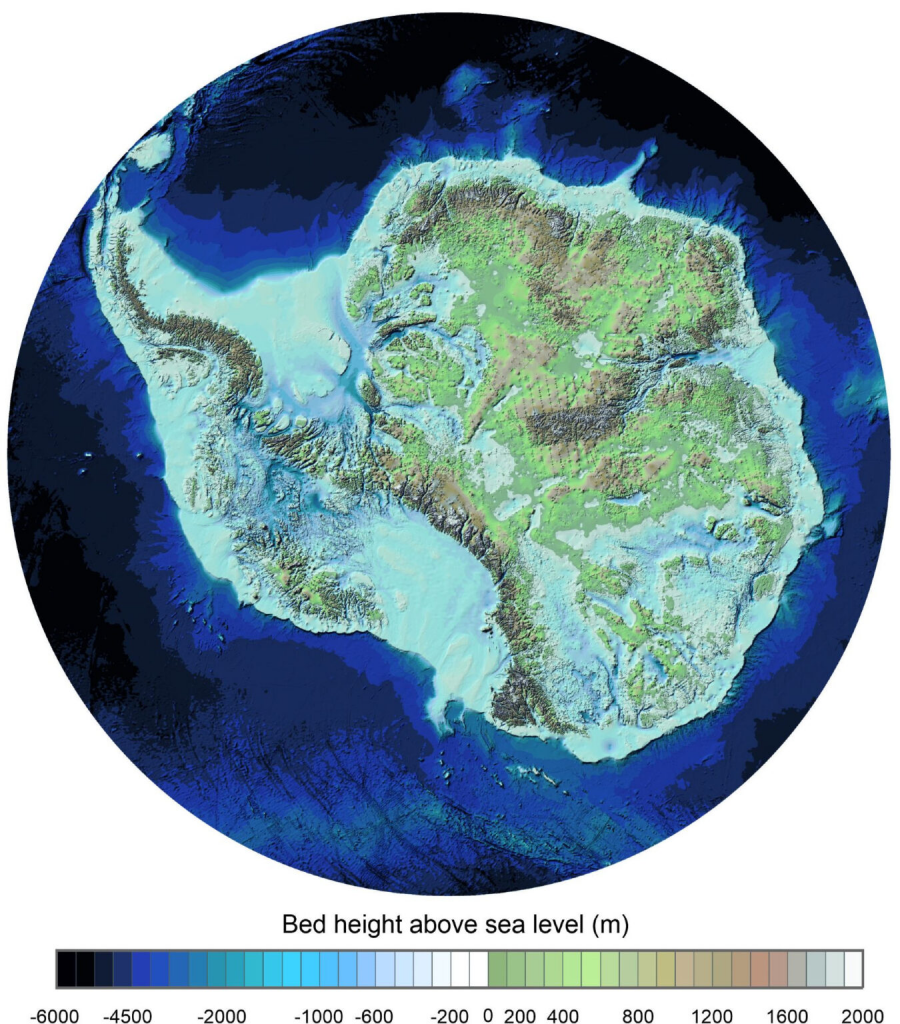
The map, called Bedmap3, was developed by an international team led by the British Antarctic Survey (BAS).
The researchers behind the project say the new map gives a clearer picture of where mountains rise, canyons plunge, and—most importantly—where ice is most likely to move as the planet heats up.
“This is the fundamental information that underpins the computer models we use to investigate how the ice will flow across the continent as temperatures rise,” Hamish Pritchard, a glaciologist at BAS and lead author on the study detailing the new map, said in a statement.
“Imagine pouring syrup over a rock cake – all the lumps, all the bumps, will determine where the syrup goes and how fast. And so it is with Antarctica: some ridges will hold up the flowing ice; the hollows and smooth bits are where that ice could accelerate.”
- Total volume of Antarctic ice, including ice shelves: 27.17 million cu km
- Total area of Antarctic ice, including ice shelves: 13.63 million sq km
- Mean thickness of Antarctic ice, including ice shelves: 1,948 m. (Excluding ice shelves: 2,148 m)
- Potential global sea-level rise if all ice melted: 58 m
Source: British Antarctic Survey
Seeing that where the continents thickest ice isn’t where originally thought, was one of the biggest surprises for the team, they said.
Earlier surveys had it at the Astrolabe Basin, but the refined data shows the real record-holder is in an unnamed canyon in Wilkes Land, where ice piles up to 4,757 metres.
Decades of data….including from dog sleds
To compile the map the team used sixty-years of data available from satellites, aircraft, ships, and even dog sleds.
This enabled the researchers to double the number of data points to 82 million, permitting them to map at a sharper resolution that will give scientists a clearer picture of how ice moves across the continent.
An early takeaway from the map suggest the Antarctic ice sheet could be more vulnerable to climate change due to a larger section resting below sea level, where it is exposed to warmer ocean currents.
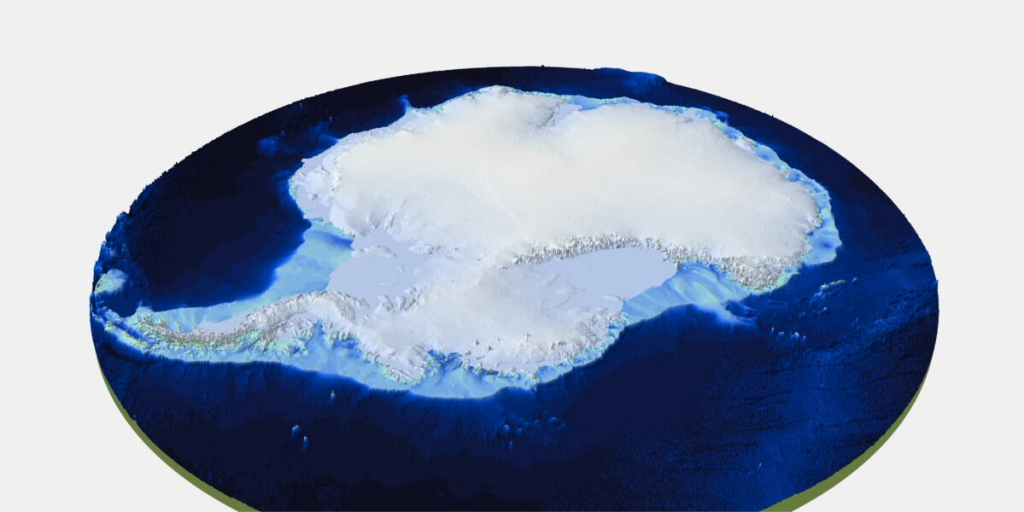
“In general, it’s become clear the Antarctic Ice Sheet is thicker than we originally realised and has a larger volume of ice that is grounded on a rock bed sitting below sea-level,” Peter Fretwell, mapping specialist and co-author at BAS, said.
“This puts the ice at greater risk of melting due to the incursion of warm ocean water that’s occurring at the fringes of the continent. What Bedmap3 is showing us is that we have got a slightly more vulnerable Antarctica than we previously thought.”
Comments, tips or story ideas? Contact Eilís at eilis.quinn(at)cbc.ca
Related stories from around the North:
Canada: Study examines physical, social costs of thawing permafrost across Arctic regions, CBC News
Norway: Thawing permafrost melts ground under homes and around Global Seed Vault in Svalbard, The Independent Barents Observer
Russia: Melting permafrost may release industrial pollutants at Arctic sites: study, Eye on the Arctic
United States: 30–50% of critical northern infrastructure could be at high risk by 2050 due to warming, says study, Eye on the Arctic