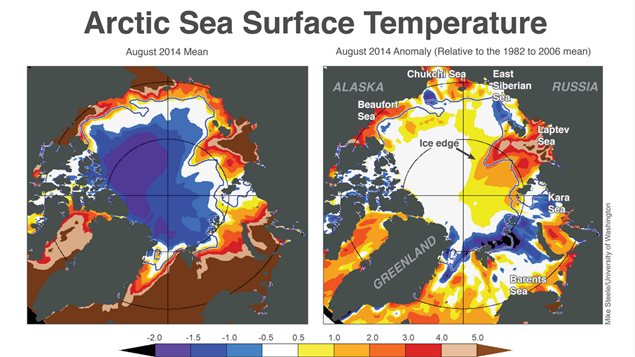
These maps show Arctic sea surface temperatures average (left) and temperature anomalies (right) for August 2014, in degrees Celsius. Sea surface temperature data are from the National Climatic Data Center’s OIv2 “Reynolds” data set, a blend of satellite advvanced Very High Resolution Radiometer) and in-situ data designed to provide a bulk or mixed layer temperature. Ice edge data are from NSIDC near-real time passive microwave data. It is clear that the northern and Arctic seas are much warmer Photo Credit: Credit: Mike Steele/University of Washington
The summer Arctic sea-ice melt season is almost at an end.
Northern residents in some areas are seeing thin sheens of ice on the sea.
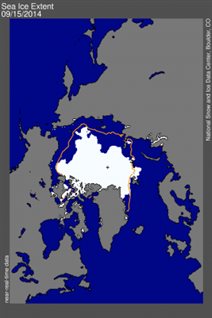
This week the National Snow and Ice Date Centre (NSIDC) said the minimum extent of Arctic sea ice will be slightly lower than last year’s, making it the sixth lowest extent in the satellite record.
NSIDC bases its analysis on satellite images of Arctic ice cover.
The agency said that the images and data on September 15, showed the ice cover had shrunk to 30,000 square kilometers less than last year at this time.
For reasons beyond our control, and for an undetermined period of time, our comment section is now closed. However, our social networks remain open to your contributions.


For reasons beyond our control, and for an undetermined period of time, our comment section is now closed. However, our social networks remain open to your contributions.