Alarming, above-average ice loss in Greenland due to rising temperatures
Satellite images from NASA show the dramatic difference warm July temperatures had on Greenland’s ice sheet.
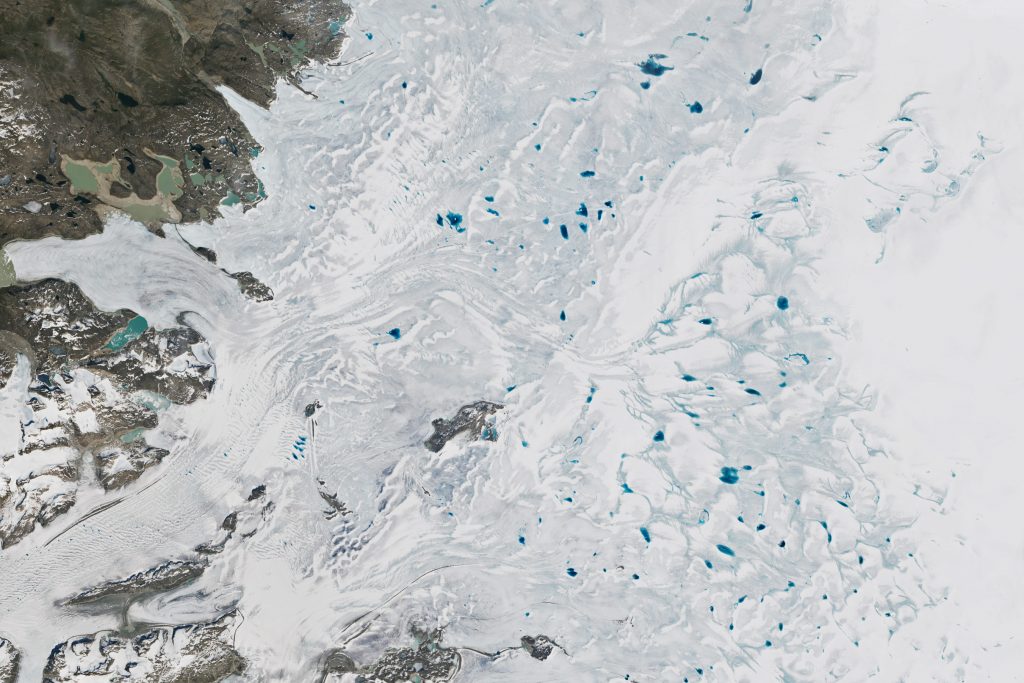
Two images (see below) were published on the American space agency’s blog of Greenland’s Frederikshåb Glacier located in the island’s southwest.
“The changes are the result of the increasing warmth of summer weather that took hold across the region in late June,” NASA said.
“That’s when warm southwesterly winds and clear skies significantly enhanced the amount of melting on the ice sheet, especially toward the island’s south.”
NASA’s Landsat 8 and Landsat 9 satellites orbit over the earth and gather approximately 1,500 images every 24 hours.
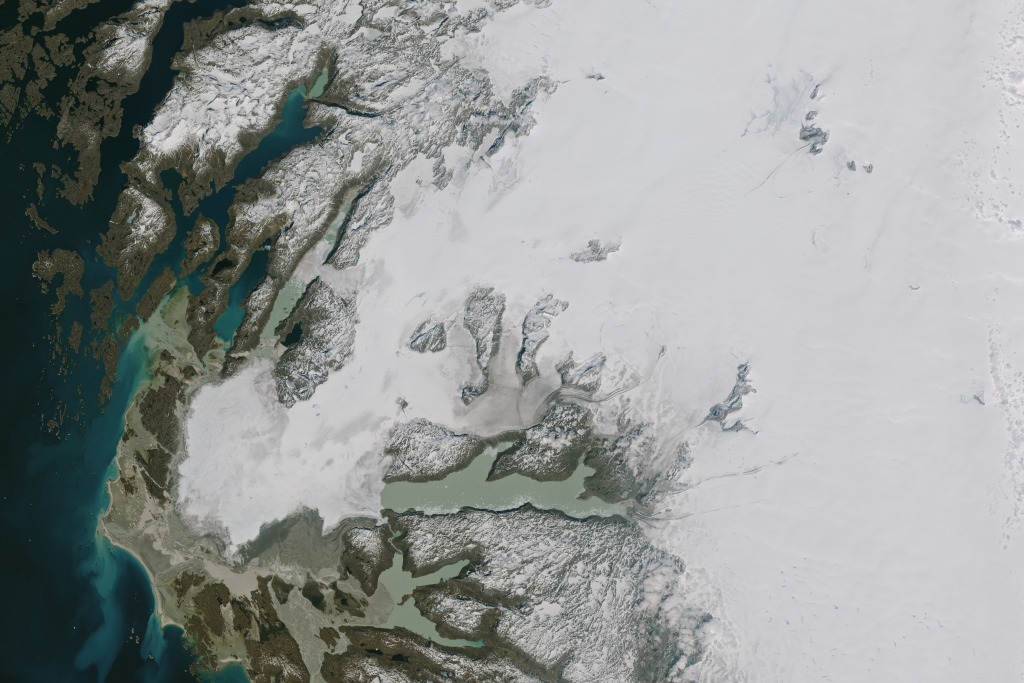
The glacier descends from the Greenland Ice Sheet and then expands as it reaches the coast.
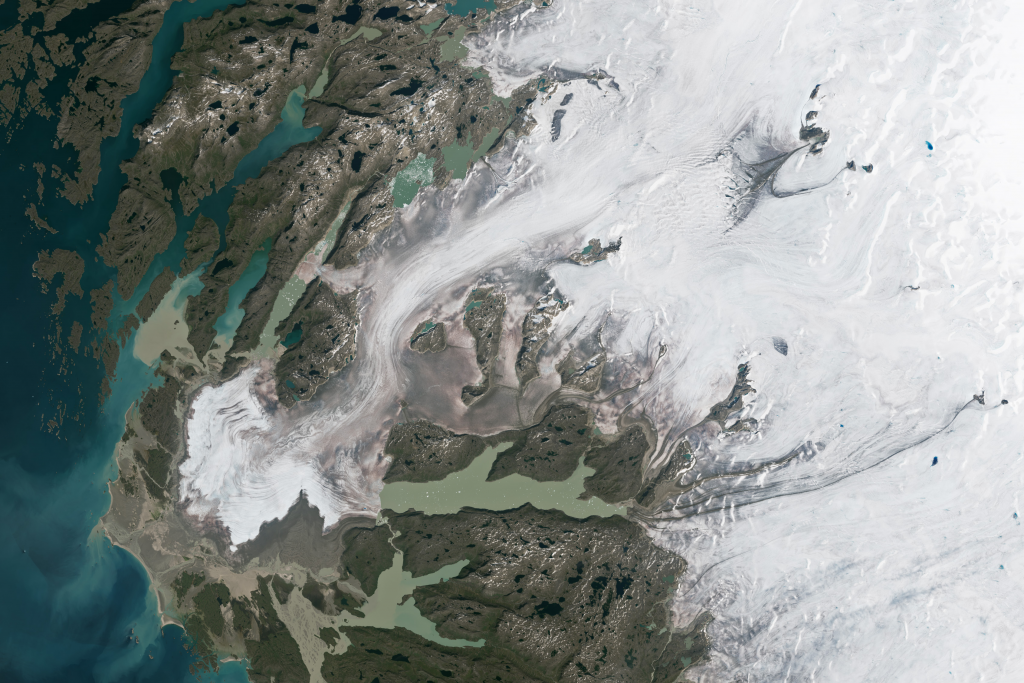
“More than halfway through the 2023 melting season, Greenland has seen a substantial transformation of its snow cover,” NASA said.
“Melting has been above average for much of the season, including on several days in June and July when melt was detected across 800,000 square kilometers (302,000 square miles)—up to 50 percent—of Greenland Ice Sheet’s surface,” it continued, citing the U.S. National Snow and Ice Data Center.
Also visible in the images is the transition from “clean” to “dirty” snow – due primarily to impurities left behind from snow melting – and dark blue melt ponds that form when meltwater pools in low spots on the ice sheet. pic.twitter.com/Crcisg0ezl
— NASA Earth (@NASAEarth) August 1, 2023
NASA said the amount of “dirty ice’ on the July 24 image compared to the June 14 image was a result black carbon and particulate dust gathering on the ice, a further contributes to melt.
“As the snow and ice melt, these impurities are left behind,” NASA said. “Darkening of the ice surface lowers its albedo, which can hasten melting through the absorption of additional solar energy in the summer months.”
Melt ponds
The amount of melt ponds in the July image compared with June, are also significant, the agency said, and can help gauge the intensity of Greenland’s melting period from May until the beginning of September.
“Only a few melt ponds are visible in the July 24 image, possibly because meltwater had already run off the ice sheet or been channeled down through the ice,” NASA said. “However, abundant melt ponds were visible about 100 kilometers (60 miles) north of Frederikshåb on July 8.”
“The drama of unprecedented melt in 2012 may not be exceeded this year,” Christopher Shuman, a University of Maryland, Baltimore County, glaciologist based at NASA’s Goddard Space Flight Center, said in a statement.
“But so far, 2023 looks to be a big, broad melt year.”
Comments, tips or story ideas? Contact Eilís at eilis.quinn(at)cbc.ca
Related stories from around the North:
Canada: Hot and dry July saw temperature records topple in the Yukon, CBC News
Norway: Polar heat record. July average above 10°C, The Independent Barents Observer
Sweden: High risk of wildfires in many parts of Sweden, including North, Radio Sweden